
Hospital IPD HMIS
Overview
Reducing administrative burden by 40% through evidence-based design. Led comprehensive UX research and product design for an AI-enabled hospital management system serving multi-specialty hospitals across India.
Categories
Healthcare
SaaS
Date
Apr 2024
Client
VigorusAI
Project Background & Overview
Healthcare professionals, particularly doctors and administrative staff, face numerous challenges in managing patient care and operational workflows. Chikitsa aims to bridge these gaps by leveraging AI-powered tools to streamline administrative tasks, enhance patient outcomes, and optimize healthcare delivery. The project focused on developing intuitive, AI-enabled products, including IPD management software tailored to the needs of healthcare professionals in hospitals and clinics.
As the product designer, I spearheaded the research, user journey mapping, and design of the IPD management software and standalone AI-enabled products tailored to the diverse needs of healthcare professionals.
Research & Discovery
Research Methodology
Conducted comprehensive mixed-methods research to understand healthcare workflow challenges:
Ethnographic Studies
Spent 40+ hours shadowing healthcare professionals across 3 hospitals in Jaipur and Delhi, observing real-time workflows during patient consultations, administrative tasks, and system interactions.
User Interviews
Conducted 12 in-depth interviews (6 doctors, 3 admin managers, 2 nurses, 1 IT admin) to understand pain points, technology adoption barriers, and workflow requirements.
Diary Studies
4 doctors documented daily workflows over 2 weeks, capturing time allocation, frustration points, and system interaction patterns.
Competitive Analysis
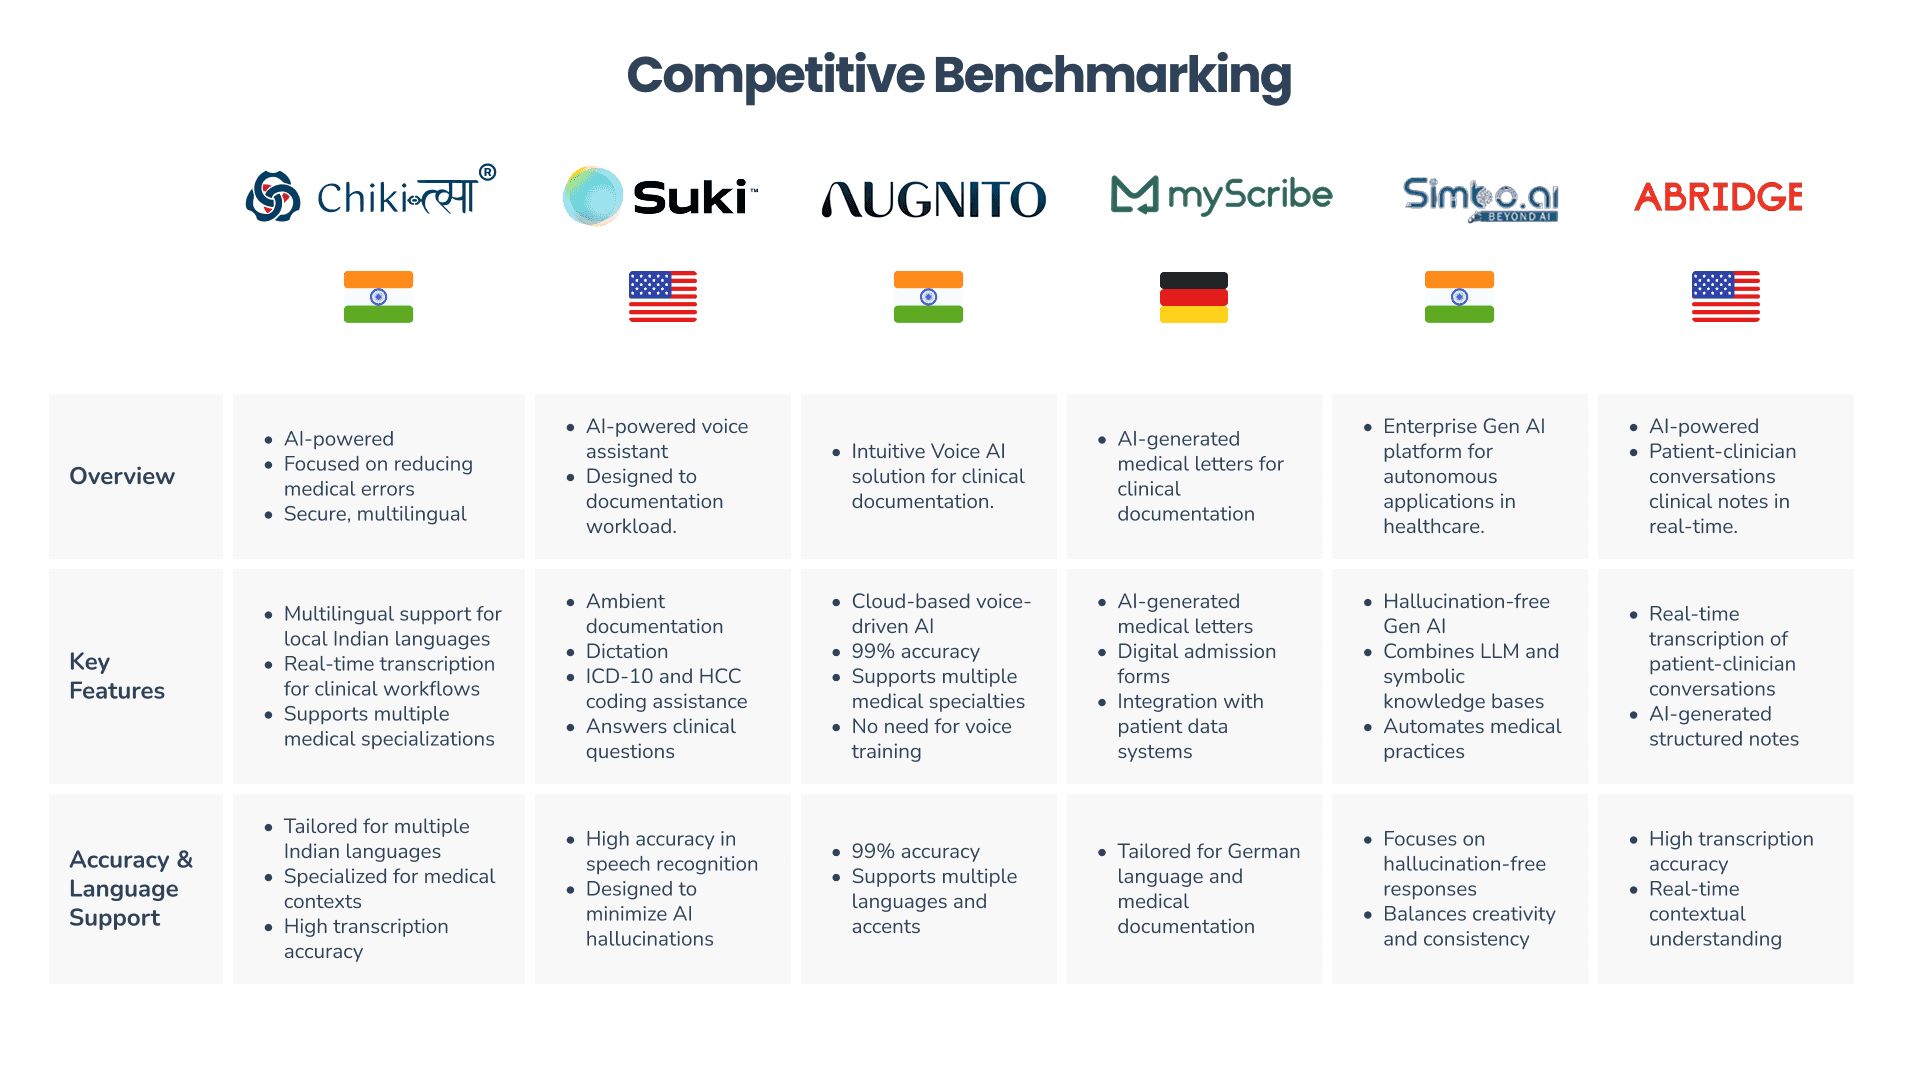
Evaluated 3 existing healthcare platforms through product demos with their teams: Suki, Augnito, MyScribe, Simbo, Abridge, HealthPlix, Eka Care, and Driefcase. Analyzed features, workflow integration, AI capabilities, and usability patterns.
Key Research Insights
Through affinity mapping of 180+ observations, five critical themes emerged:
Time Management Crisis: Doctors spent 40% of appointment time on administrative tasks, with 15-20 minutes per patient just on documentation.
System Fragmentation: Patient data scattered across 3-5 disconnected systems requiring constant switching and manual data transfer.
Data Accessibility: Critical patient information buried in lengthy records with no quick access to medication history or diagnostic reports.
Technology Resistance: Previous implementations failed due to complexity and lack of training, creating skepticism toward new tools.
Decision Support Gap: Doctors needed data-driven insights for clinical decisions but current systems provided raw data without intelligence.
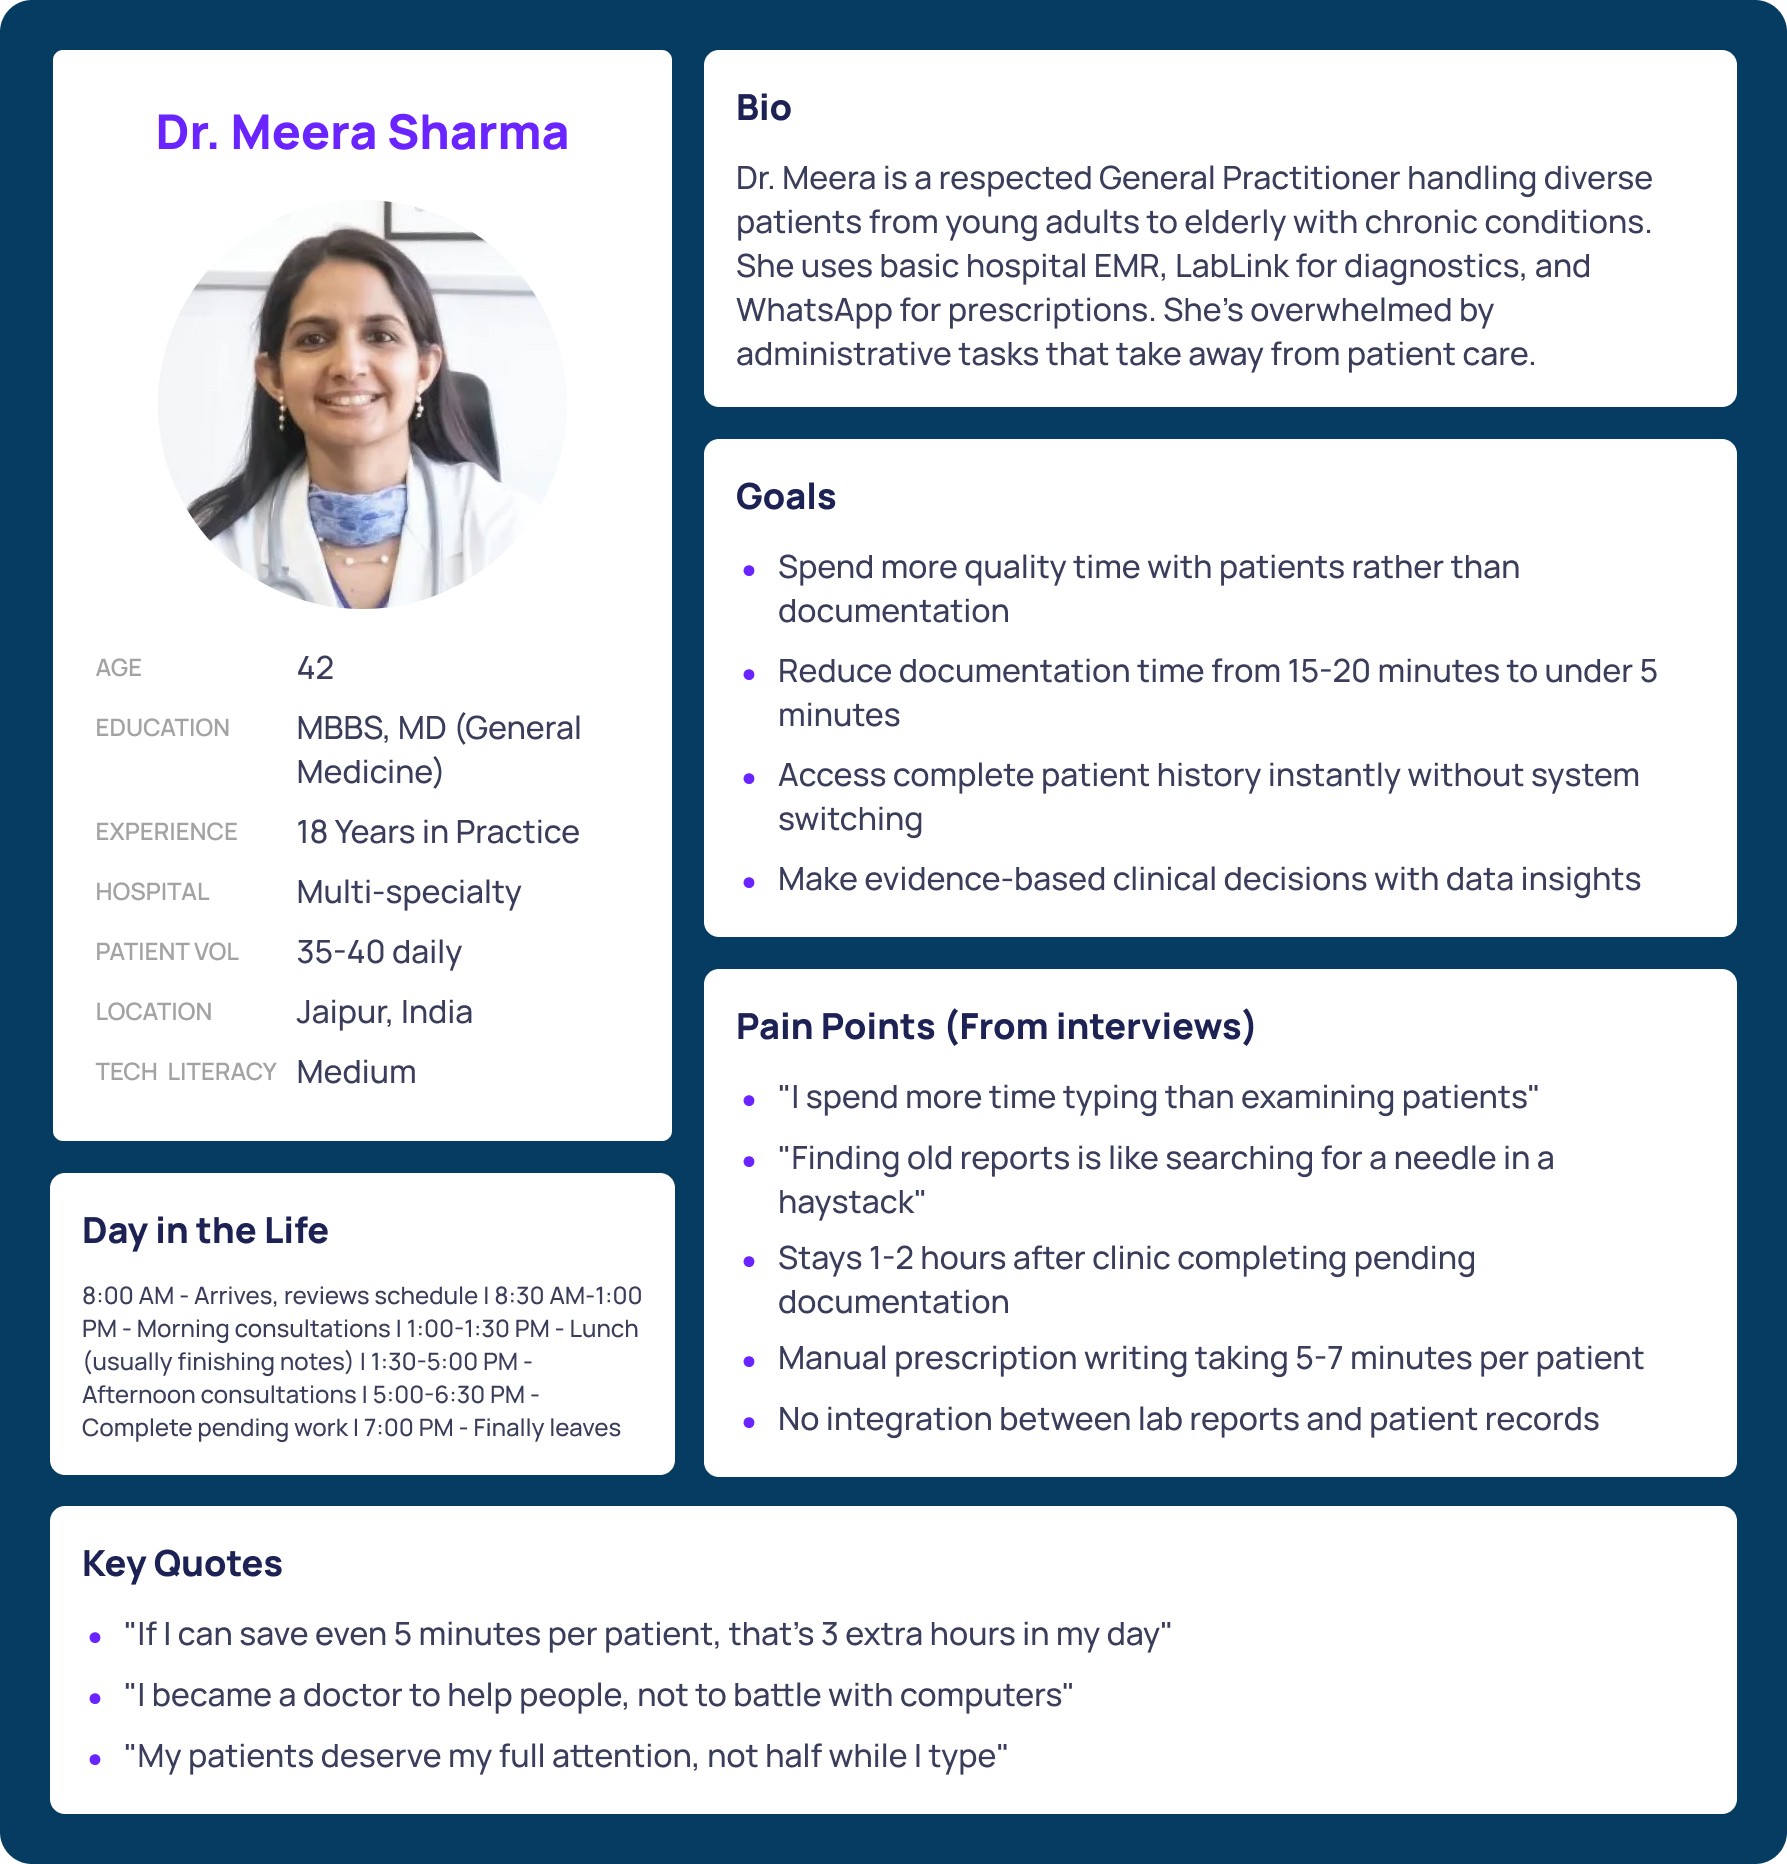
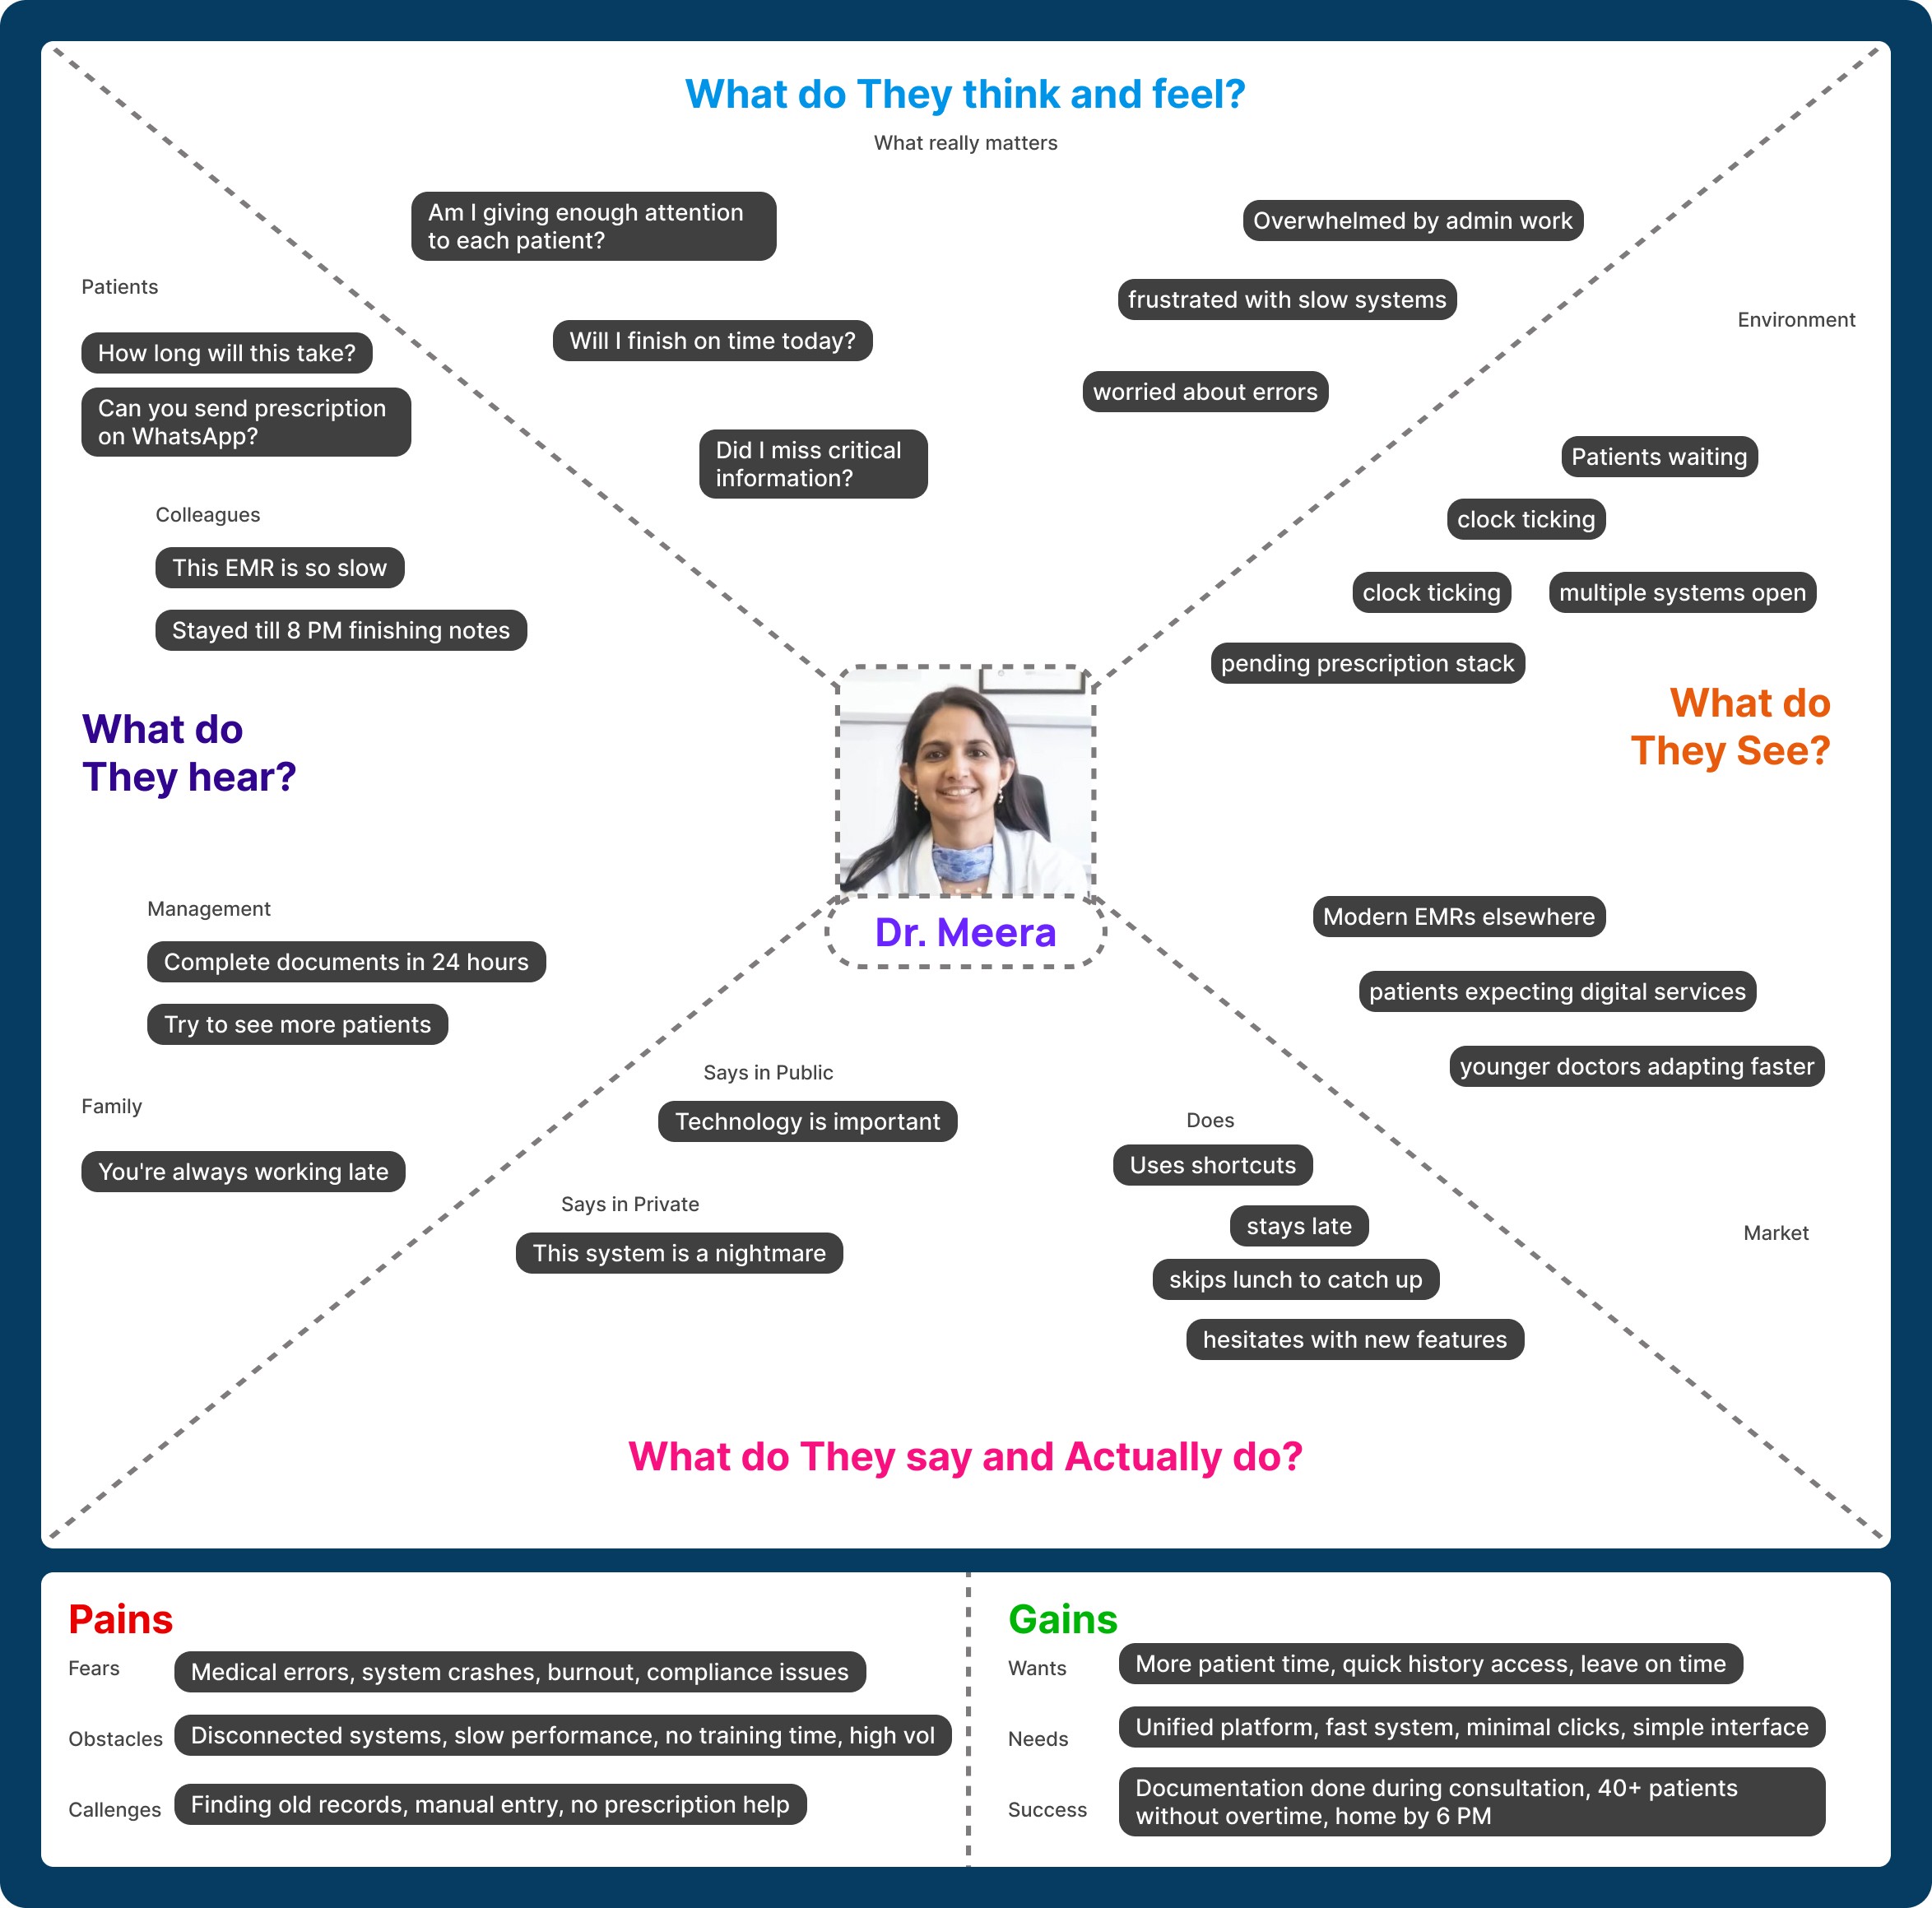
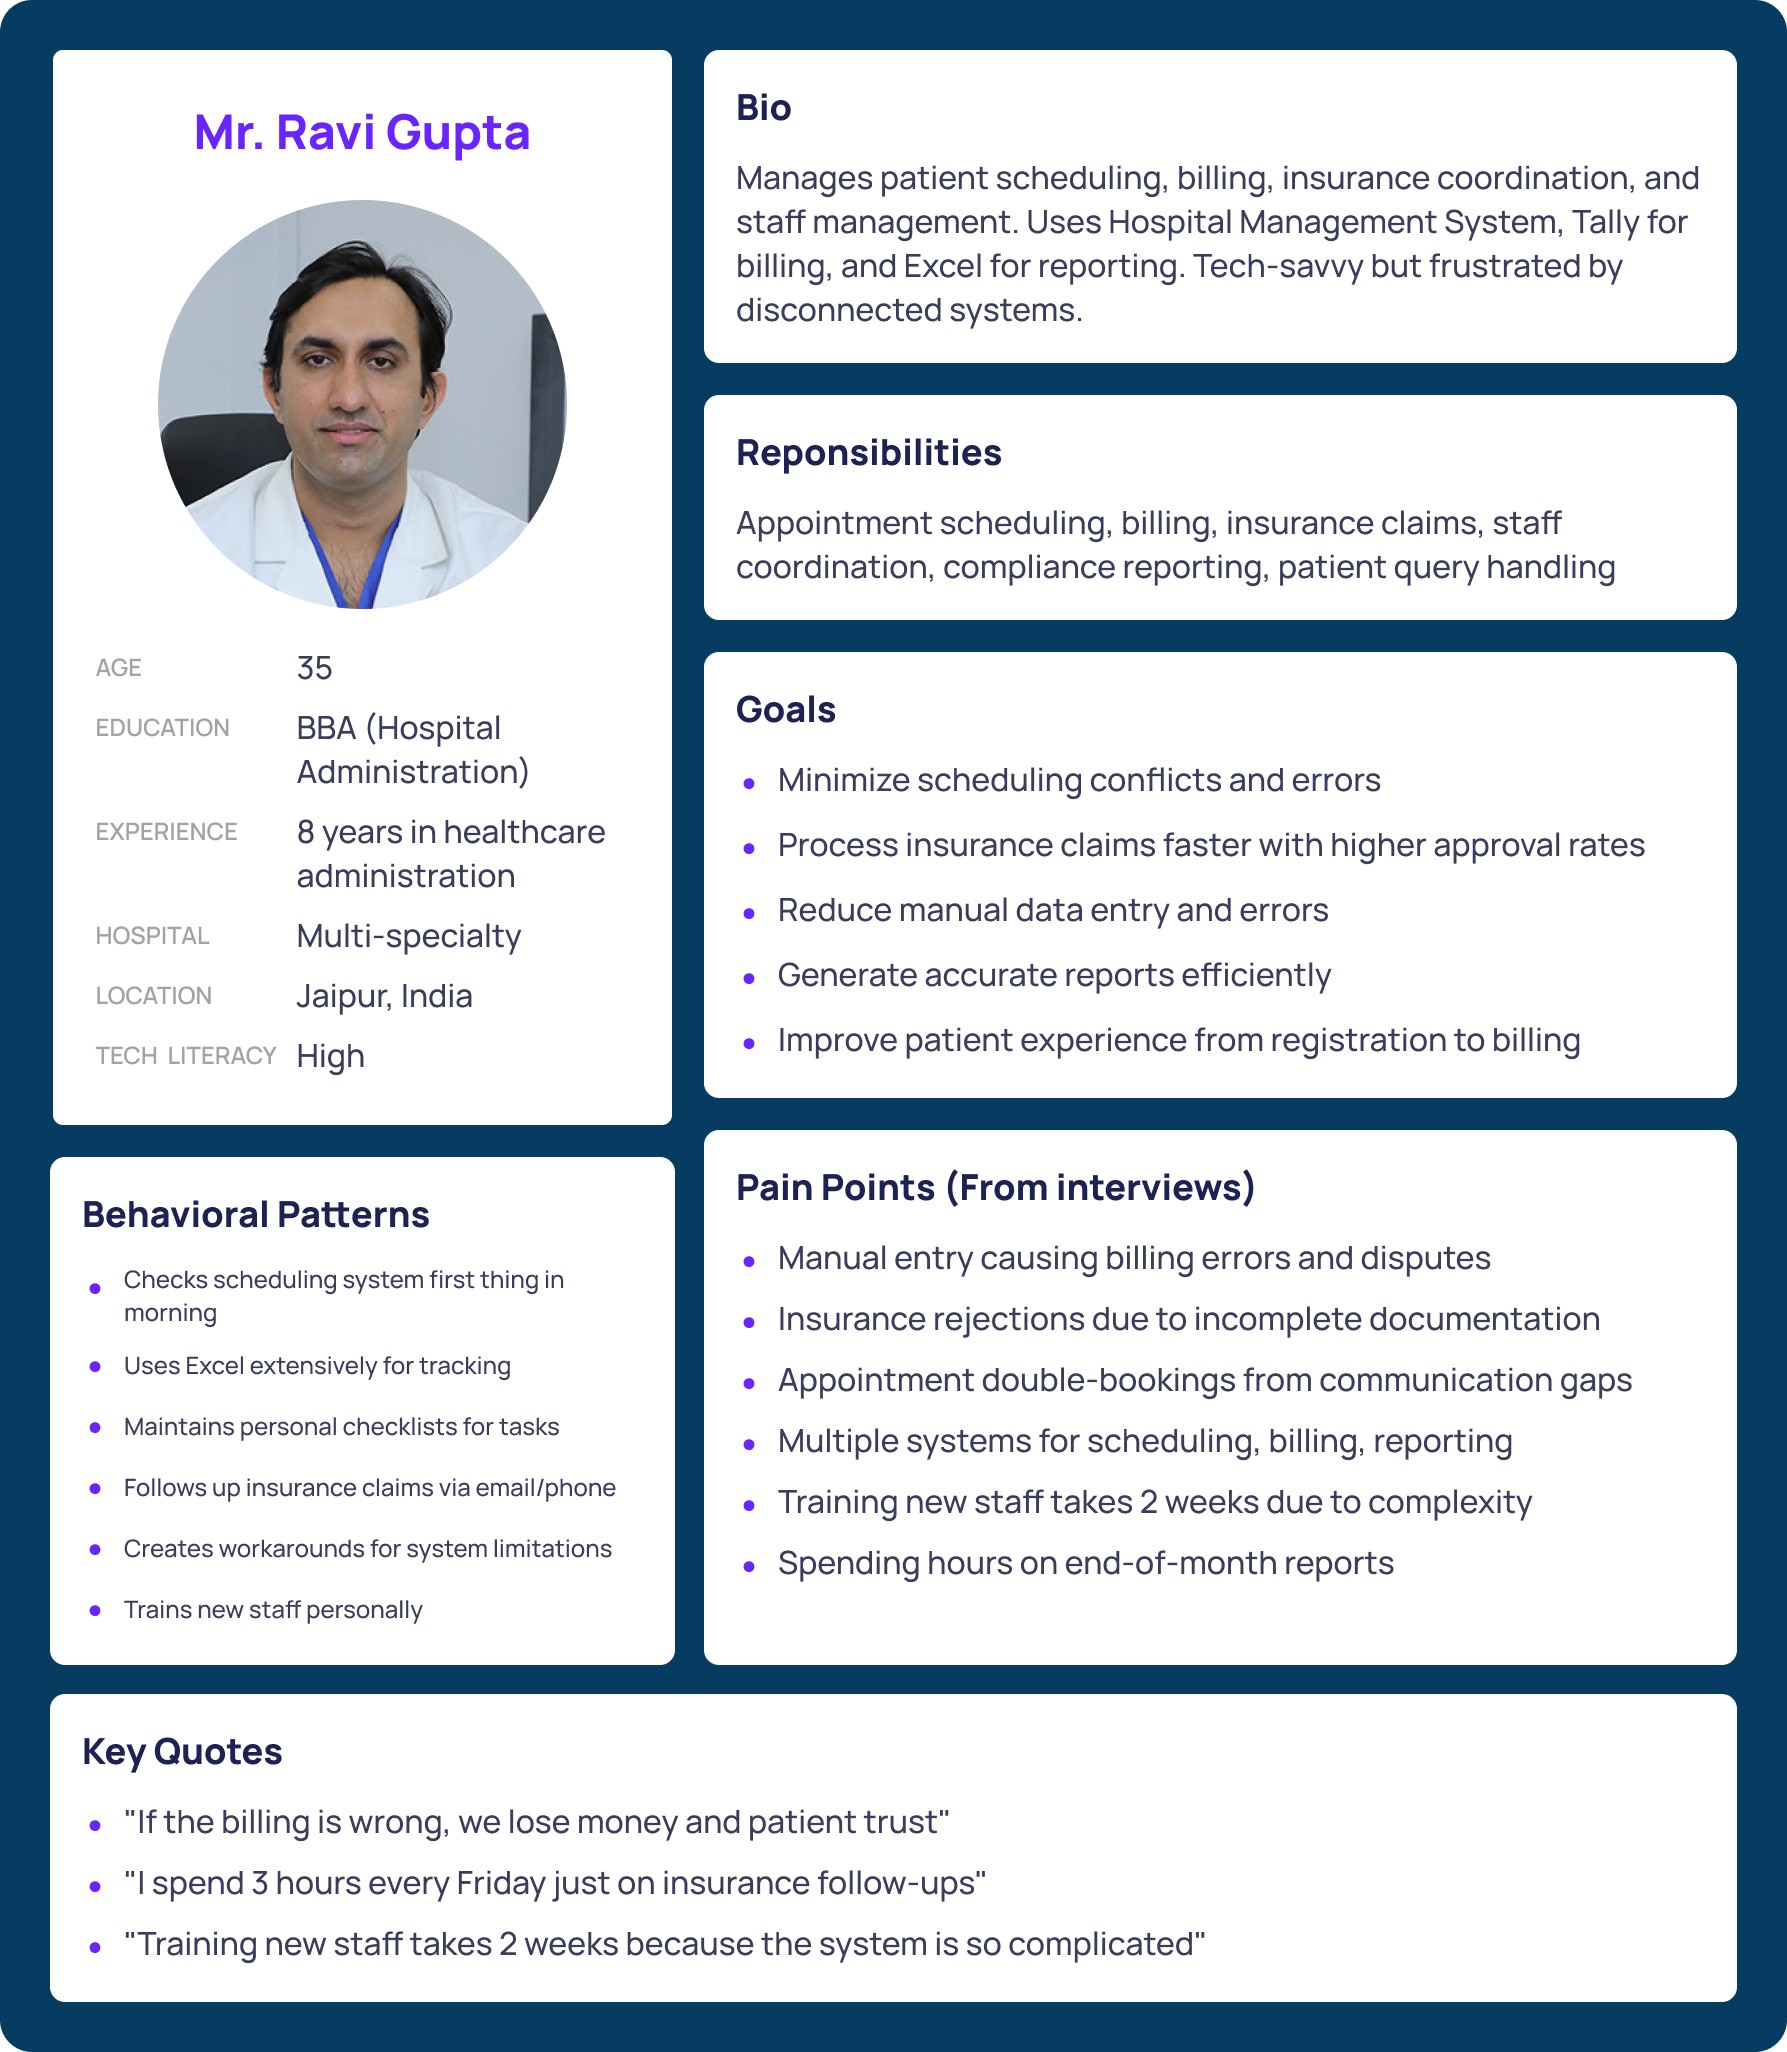
User Personas & Empathy Maps
Dr. Meera Sharma, 42
Mr. Ravi Gupta, 35
Information Architecture
Site Map
Developed hierarchical IA with 6 primary sections:
Dashboard (personalized)
Patient Management
Clinical Tools
Analytics & Insights
Administration
Settings
User Journey Mapping
Created detailed journey maps for primary personas highlighting pain points and opportunities.
Dr. Meera's Morning Clinic Journey:
Phases: Pre-clinic → Consultations → Documentation → Review
Key Pain Points: Finding records across systems, waiting for diagnostics, repetitive data entry, system timeouts
Opportunities: Unified dashboard, predictive loading, templates, offline mode
Design Approach & Process

Framework: Double Diamond Design Process
Ideation & Prioritization
Facilitated 3 workshops generating 60+ solution concepts, prioritized using Impact vs. Effort matrix. Identified 15 high-impact, medium-effort features for MVP.
Wireframing Evolution
Low-Fidelity (Week 1-2): Paper sketches for 12 key screens
Mid-Fidelity (Week 3-4): Digital wireframes with cognitive walkthroughs
High-Fidelity (Week 5-6): Refined wireframes ready for usability testing
Usability Testing
Testing Protocol
Participants: 5 doctors, 3 admin staff
Method: Moderated sessions, think-aloud protocol
Duration: 60 minutes per session
Tasks: 8 scenarios per participant
Key Results
Task Success Rate: 87.5%
Task Completion Time: 12% faster than target
System Usability Scale (SUS): 78.5 (Grade B)
Critical Errors: 3 across all sessions
Critical Findings & Iterations
Issue 1: Analytics Discoverability
Only 37.5% found analytics without help
Solution: Moved to primary nav, added dashboard widgets
Validation: 100% discoverability in re-test
Issue 2: Prescription Efficiency
Required 4 clicks vs. expected 1-2
Solution: Combined steps, added keyboard shortcuts
Validation: Reduced to 2 clicks, 40% faster
Issue 3: AI Feature Visibility
25% missed AI insights panel
Solution: Increased prominence, added indicators
Validation: 100% recognition in follow-up
Final Design Solution
Core Features
Doctor's Dashboard
Today's appointments with patient summaries
Pending tasks and alerts
AI-generated clinical insights
Quick search and performance metrics
Integrated Patient Record
Single-page complete history
Timeline of interactions
Medication reconciliation with warnings
Allergy and contraindication highlights
AI-Assisted Prescription Tool
Natural language input
Automated interaction checking
Common templates
Digital signature integration
Administrative Command Center
Appointment scheduling with conflict detection
Automated billing workflows
Patient queue management
Compliance dashboard
Design Principles
Clinical Clarity: Information hierarchy optimized for high-pressure medical environments
Intelligent Defaults: System anticipates needs based on context, reducing cognitive load
Transparent AI: Recommendations clearly labeled with confidence levels, users maintain full control
Efficiency Through Design: Every interaction optimized for speed with keyboard shortcuts and batch operations


Results & Impact
Quantitative Outcomes
Operational Efficiency:
40% reduction in administrative time
60% faster patient record retrieval
75% reduction in scheduling conflicts
35% decrease in billing errors
User Adoption:
89% user satisfaction score
94% daily usage within 2 weeks
67% reduction in support tickets
Clinical Impact:
25% increase in patients seen per day
15% improvement in prescription accuracy
82% reported enhanced decision-making
Qualitative Feedback
Doctors:
"This is the first EMR that actually helps me practice medicine"
"I can finally see all patient information in one place"
Admin Staff:
"Scheduling is so much faster and more accurate"
"Training new staff takes days instead of weeks"
Key Learnings
Ethnographic Observation Reveals Hidden Insights: Watching doctors work revealed micro-inefficiencies they'd normalized and wouldn't mention in interviews. Real-world observation was invaluable.
Mental Models Drive Intuitive IA: Card sorting revealed how doctors and admin staff think differently about information organization. Building IA from actual mental models eliminated the need for extensive training.
AI Transparency Builds Trust: Healthcare professionals embraced AI when they understood reasoning and maintained control. Showing confidence levels and allowing overrides was critical for adoption.
Iterative Testing Prevents Costly Mistakes: Three rounds of testing and iteration caught usability issues before development, saving time and ensuring the final product met real user needs.
Hospital IPD HMIS
Overview
Reducing administrative burden by 40% through evidence-based design. Led comprehensive UX research and product design for an AI-enabled hospital management system serving multi-specialty hospitals across India.
Categories
Healthcare
SaaS
Date
Apr 2024
Client
VigorusAI
Project Background & Overview
Healthcare professionals, particularly doctors and administrative staff, face numerous challenges in managing patient care and operational workflows. Chikitsa aims to bridge these gaps by leveraging AI-powered tools to streamline administrative tasks, enhance patient outcomes, and optimize healthcare delivery. The project focused on developing intuitive, AI-enabled products, including IPD management software tailored to the needs of healthcare professionals in hospitals and clinics.
As the product designer, I spearheaded the research, user journey mapping, and design of the IPD management software and standalone AI-enabled products tailored to the diverse needs of healthcare professionals.
Research & Discovery
Research Methodology
Conducted comprehensive mixed-methods research to understand healthcare workflow challenges:
Ethnographic Studies
Spent 40+ hours shadowing healthcare professionals across 3 hospitals in Jaipur and Delhi, observing real-time workflows during patient consultations, administrative tasks, and system interactions.
User Interviews
Conducted 12 in-depth interviews (6 doctors, 3 admin managers, 2 nurses, 1 IT admin) to understand pain points, technology adoption barriers, and workflow requirements.
Diary Studies
4 doctors documented daily workflows over 2 weeks, capturing time allocation, frustration points, and system interaction patterns.
Competitive Analysis
Evaluated 3 existing healthcare platforms through product demos with their teams: Suki, Augnito, MyScribe, Simbo, Abridge, HealthPlix, Eka Care, and Driefcase. Analyzed features, workflow integration, AI capabilities, and usability patterns.
Key Research Insights
Through affinity mapping of 180+ observations, five critical themes emerged:
Time Management Crisis: Doctors spent 40% of appointment time on administrative tasks, with 15-20 minutes per patient just on documentation.
System Fragmentation: Patient data scattered across 3-5 disconnected systems requiring constant switching and manual data transfer.
Data Accessibility: Critical patient information buried in lengthy records with no quick access to medication history or diagnostic reports.
Technology Resistance: Previous implementations failed due to complexity and lack of training, creating skepticism toward new tools.
Decision Support Gap: Doctors needed data-driven insights for clinical decisions but current systems provided raw data without intelligence.
User Personas & Empathy Maps
Dr. Meera Sharma, 42
Mr. Ravi Gupta, 35
Information Architecture
Site Map
Developed hierarchical IA with 6 primary sections:
Dashboard (personalized)
Patient Management
Clinical Tools
Analytics & Insights
Administration
Settings
User Journey Mapping
Created detailed journey maps for primary personas highlighting pain points and opportunities.
Dr. Meera's Morning Clinic Journey:
Phases: Pre-clinic → Consultations → Documentation → Review
Key Pain Points: Finding records across systems, waiting for diagnostics, repetitive data entry, system timeouts
Opportunities: Unified dashboard, predictive loading, templates, offline mode
Design Approach & Process
Framework: Double Diamond Design Process
Ideation & Prioritization
Facilitated 3 workshops generating 60+ solution concepts, prioritized using Impact vs. Effort matrix. Identified 15 high-impact, medium-effort features for MVP.
Wireframing Evolution
Low-Fidelity (Week 1-2): Paper sketches for 12 key screens
Mid-Fidelity (Week 3-4): Digital wireframes with cognitive walkthroughs
High-Fidelity (Week 5-6): Refined wireframes ready for usability testing
Usability Testing
Testing Protocol
Participants: 5 doctors, 3 admin staff
Method: Moderated sessions, think-aloud protocol
Duration: 60 minutes per session
Tasks: 8 scenarios per participant
Key Results
Task Success Rate: 87.5%
Task Completion Time: 12% faster than target
System Usability Scale (SUS): 78.5 (Grade B)
Critical Errors: 3 across all sessions
Critical Findings & Iterations
Issue 1: Analytics Discoverability
Only 37.5% found analytics without help
Solution: Moved to primary nav, added dashboard widgets
Validation: 100% discoverability in re-test
Issue 2: Prescription Efficiency
Required 4 clicks vs. expected 1-2
Solution: Combined steps, added keyboard shortcuts
Validation: Reduced to 2 clicks, 40% faster
Issue 3: AI Feature Visibility
25% missed AI insights panel
Solution: Increased prominence, added indicators
Validation: 100% recognition in follow-up
Critical Findings & Iterations
Issue 1: Analytics Discoverability
Only 37.5% found analytics without help
Solution: Moved to primary nav, added dashboard widgets
Validation: 100% discoverability in re-test
Issue 2: Prescription Efficiency
Required 4 clicks vs. expected 1-2
Solution: Combined steps, added keyboard shortcuts
Validation: Reduced to 2 clicks, 40% faster
Issue 3: AI Feature Visibility
25% missed AI insights panel
Solution: Increased prominence, added indicators
Validation: 100% recognition in follow-up
Final Design Solution
Core Features
Doctor's Dashboard
Today's appointments with patient summaries
Pending tasks and alerts
AI-generated clinical insights
Quick search and performance metrics
Integrated Patient Record
Single-page complete history
Timeline of interactions
Medication reconciliation with warnings
Allergy and contraindication highlights
AI-Assisted Prescription Tool
Natural language input
Automated interaction checking
Common templates
Digital signature integration
Administrative Command Center
Appointment scheduling with conflict detection
Automated billing workflows
Patient queue management
Compliance dashboard
Design Principles
Clinical Clarity: Information hierarchy optimized for high-pressure medical environments
Intelligent Defaults: System anticipates needs based on context, reducing cognitive load
Transparent AI: Recommendations clearly labeled with confidence levels, users maintain full control
Efficiency Through Design: Every interaction optimized for speed with keyboard shortcuts and batch operations
Results & Impact
Quantitative Outcomes
Operational Efficiency:
40% reduction in administrative time
60% faster patient record retrieval
75% reduction in scheduling conflicts
35% decrease in billing errors
User Adoption:
89% user satisfaction score
94% daily usage within 2 weeks
67% reduction in support tickets
Clinical Impact:
25% increase in patients seen per day
15% improvement in prescription accuracy
82% reported enhanced decision-making
Qualitative Feedback
Doctors:
"This is the first EMR that actually helps me practice medicine"
"I can finally see all patient information in one place"
Admin Staff:
"Scheduling is so much faster and more accurate"
"Training new staff takes days instead of weeks"
Key Learnings
Ethnographic Observation Reveals Hidden Insights: Watching doctors work revealed micro-inefficiencies they'd normalized and wouldn't mention in interviews. Real-world observation was invaluable.
Mental Models Drive Intuitive IA: Card sorting revealed how doctors and admin staff think differently about information organization. Building IA from actual mental models eliminated the need for extensive training.
AI Transparency Builds Trust: Healthcare professionals embraced AI when they understood reasoning and maintained control. Showing confidence levels and allowing overrides was critical for adoption.
Iterative Testing Prevents Costly Mistakes: Three rounds of testing and iteration caught usability issues before development, saving time and ensuring the final product met real user needs.


© 2025 Prateek Singhal
© 2025 Prateek Singhal
© 2025 Prateek Singhal